


 Select your language:

Happy Eating Rating: Discover the Top 10 Happiest States and Their Eating Habits


What’s the best way to eat happiness? Find out why some states are so happy by looking at their eating habits.

In our fast-paced modern world, happiness often seems elusive. Could the key to a brighter outlook lie on our plates? From the impact of eating patterns on mental health to the role of dietary choices in inducing happiness, the influence of food on our mood becomes increasingly evident.1, 2
Inspired by these findings, our team of researchers embarked on an investigation. What kind of eating patterns do the happiest states in America follow? Could there be a correlation between their joyful demeanor and their dietary habits?
To shed light on this subject, we delved into the Happy Eating rating. Examining the food consumption patterns of the happiest states, we aimed to unravel the intricate relationship between diet and happiness.
For that, we used the freshest and most accurate data from several sources, including:
- The Happiness Index (US, 2023)
- States That Eat the Healthiest (US, 2022)
- The Most Active Searchers for Healthy Eating (US, 2022)
- The Number of Fast Food Outlets (US, 2023)
- Most Popular Fast Food Chains and Restaurant Chains (US, 2022)
- The Mean Amount Spent on Cooking at Home and Food Prepared Elsewhere (US, 2023)
- Alcohol Consumption (US, 2018)
- Popular Soda Choices (US, 2023)
- Most Popular Diets Based on Google Searches (US, 2022)
Examining this data, we aim to establish a link between eating habits and happiness. This will shed light on the factors that impact overall health and well-being in America.
Top 10 Happiest States and Their Eating Habits
| State | Happiness Rank |
|---|---|
| Massachusetts | 1 |
| Illinois | 2 |
| Connecticut | 3 |
| New Jersey | 4 |
| New York | 5 |
| Maryland | 6 |
| Minnesota | 7 |
| California | 8 |
| Hawaii | 9 |
| Vermont | 10 |
| Rhode Island | 11 |
| New Hampshire | 12 |
| Colorado | 13 |
| Maine | 14 |
| Washington | 15 |
| Delaware | 16 |
| Virginia | 17 |
| Oregon | 18 |
| Nebraska | 19 |
| Pennsylvania | 20 |
| Wisconsin | 21 |
| South Dakota | 22 |
| Montana | 23 |
| New Mexico | 24 |
| Alaska | 25 |
| Iowa | 26 |
| Nevada | 27 |
| Wyoming | 28 |
| Arizona | 29 |
| Florida | 30 |
| North Dakota | 31 |
| Michigan | 32 |
| North Carolina | 33 |
| Idaho | 34 |
| Kansas | 35 |
| Utah | 36 |
| Texas | 37 |
| Ohio | 38 |
| Indiana | 39 |
| Georgia | 40 |
| South Carolina | 41 |
| Missouri | 42 |
| Tennessee | 43 |
| Oklahoma | 44 |
| Alabama | 45 |
| Louisiana | 46 |
| Kentucky | 47 |
| Mississippi | 48 |
| Arkansas | 49 |
| West Virginia | 50 |
Key takeaways
Happiness and healthy eating go hand in hand, as the happiest states also rank high in healthy eating. They actively search for tips online, showing genuine interest in well-being.
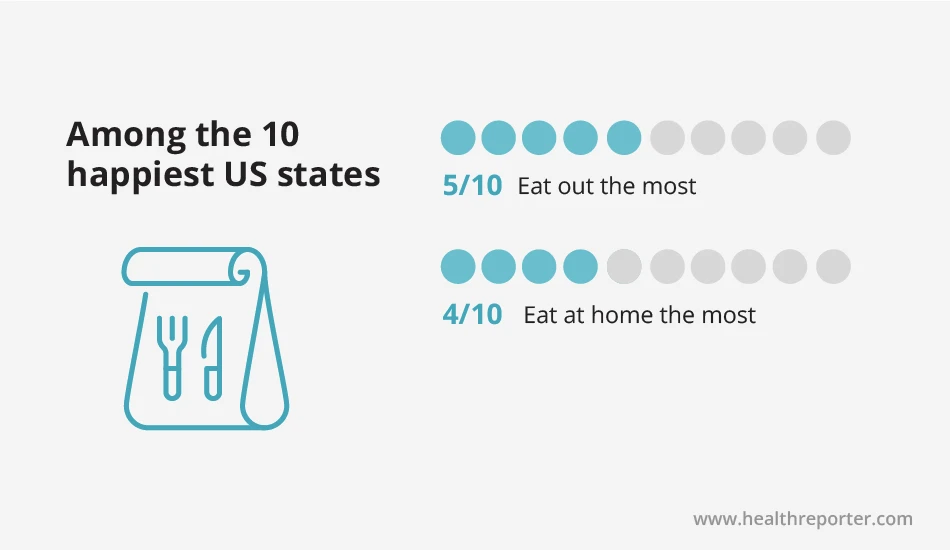
Most happy states ate more than others both at home and outside (that is, tasty food definitely makes their residents feel better). The happiest states mostly lean toward vegan, vegetarian, or weight loss diets.
Surprisingly, junk food plays a role in well-being, too. Half of the happiest states have the highest number of fast-food outlets in the US, showing that occasional indulgences can contribute to their overall happiness.
While some of these states prioritize the consumption of fruits and vegetables, others rank lower in this aspect. Also, they mainly exhibit a moderate approach to alcohol consumption.
The most popular restaurant type among the happiest states is pizza, and the most popular fast food type is Chick-fil-A.
In summary, the happiest states prioritize nutritional eating, search for health information online, and balance home cooking and dining out. Also, they have diverse dietary preferences, embrace occasional fast food treats, and practice moderation in alcohol consumption. These factors contribute to their overall happiness and quality of life.
Correlations worth looking into
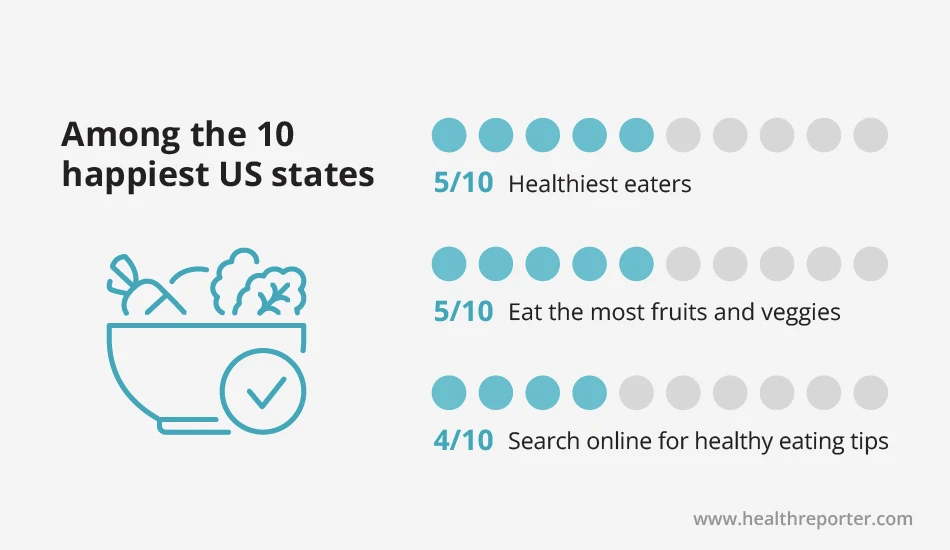
- 5 of the 10 happiest states are in the top 10 healthiest states.
- 5 of the 10 happiest states are among the top 10 states for fruit and vegetable consumption.
- 4 of the 10 happiest states actively search online for healthy eating tips.
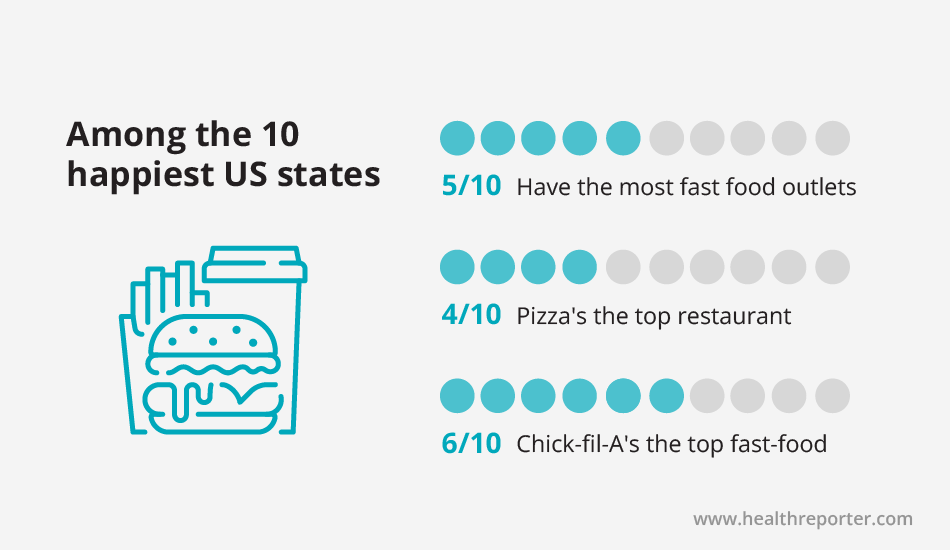
- 5 of the 10 happiest US states have the most fast food outlets per 100,000 people.
- In 4 of the 10 happiest states, pizza is the most popular type of restaurant.
- In 6 of the 10 happiest states, Chick-fil-A is the most popular fast-food restaurant.
- 5 of the 10 happiest states spend the most on food eaten away from home, including delivery.
- 4 of the 10 happiest US states spend the most on food eaten at home.
- Most popular diets in the happiest states (according to Google search volume, 2022):
- In 5 of the 10 happiest states – vegetarian and vegan diet
- In 4 of the 10 happiest states – the Weight Watchers diet
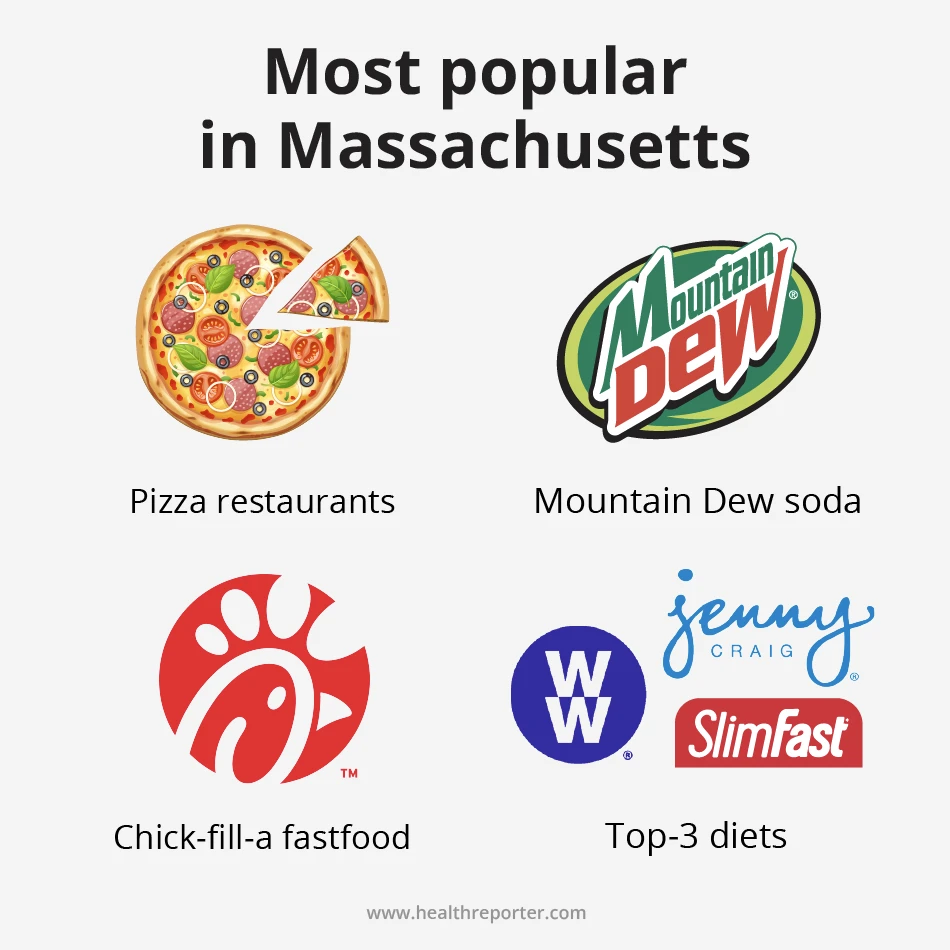
#1 Massachusetts
The happiest US state, Massachusetts, scores high in healthy eating, ranking 4th in the country. 62.40% of searches for healthy eating tips show that residents are actively trying to improve their diets.
Massachusetts has a relatively high number of fast food outlets, with 77.5 per 100,000 people. While the state prioritizes healthy eating, residents also appreciate fast food indulgence.
- Most popular restaurant type: pizza
- Most popular fast-food restaurant: Chick-fil-A (often focuses on healthier options than other fast-food chains)
- Most popular soda: Mountain Dew
- Most popular diets: Weight Watchers, Jenny Craig, and SlimFast diets
Massachusetts residents spend an average of $247.02 on groceries, ranking 32nd. Although many people cook at home, the amount spent is relatively low.
On the other hand, the average amount spent on food prepared elsewhere, including eating out and delivery, is $102.44, ranking 15th. This suggests that Massachusetts residents enjoy eating out and ordering food from outside sources.
While alcohol is consumed in the state, it is not among the highest-ranked states for alcohol consumption. Residents appear to take a balanced approach, emphasizing moderation and responsible drinking.
Overall, Massachusetts demonstrates a balance between healthy eating habits, occasional fast food indulgences, and a preference for eating out.
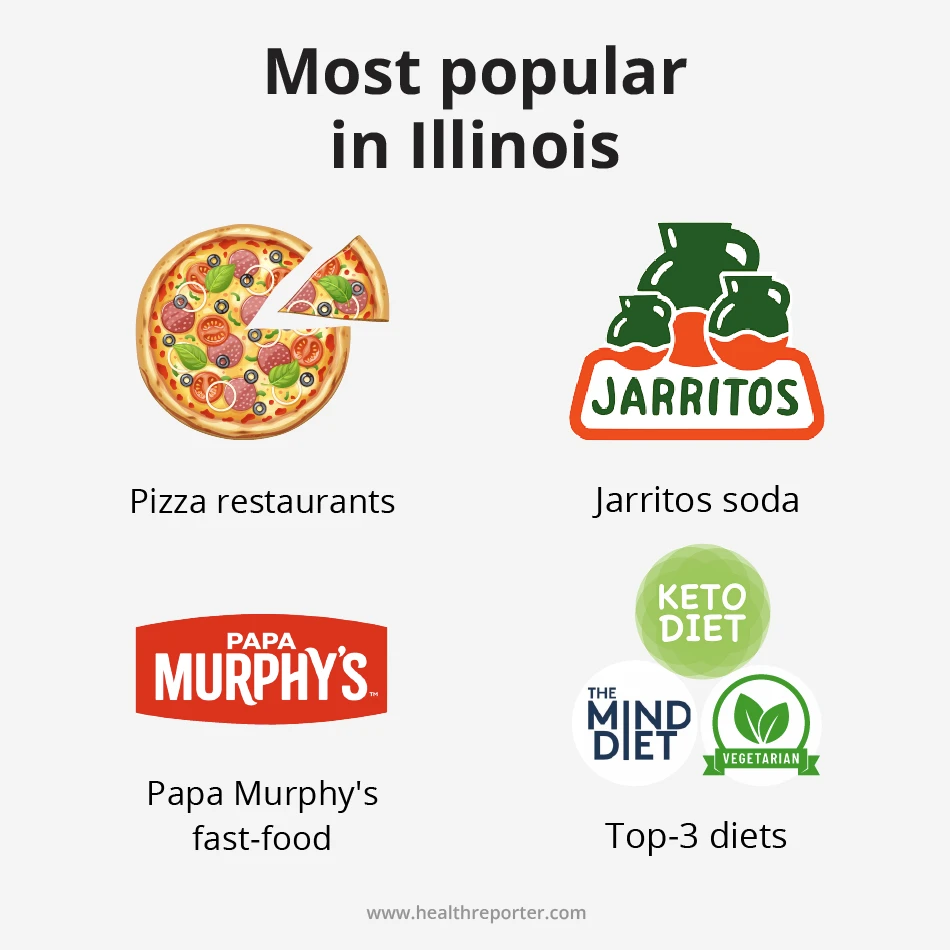
#2 Illinois
The second happiest state – Illinois – ranks 22nd regarding healthy eating. Residents here care about nutrition, yet their eating habits could be more nutritious.
This state has a relatively high number of fast food outlets, with 82.5 per 100,000 people, ranking 7th highest in the country. It’s easy for Illinois residents to get junk food, reflecting their preference for quick meals.
- Most popular restaurant type: pizza
- Most popular fast-food restaurant: Papa Murphy’s
- Most popular soda: Jarritos
- Most popular diets: the MIND diet, keto, and vegetarian diets
Illinois residents spend $266.85 on groceries, ranking 13th. A significant portion of the population values home-cooked meals and invests in food. However, the average amount spent on eating out and delivery is $109.38, ranking 9th highest. Illinois residents also enjoy eating out and ordering food from outside sources.
While alcohol is consumed in the state, it is not one of the highest-ranked states for alcohol consumption – Illinois ranks 23rd. Residents regularly eat healthy foods, ranking 21st in fruit and vegetable consumption.
In short, the second happiest state has a mix of eating habits. It has many fast-food outlets and strives for a balance between cooking at home and eating out. While conscious eating is valued here, healthier habits can be improved.
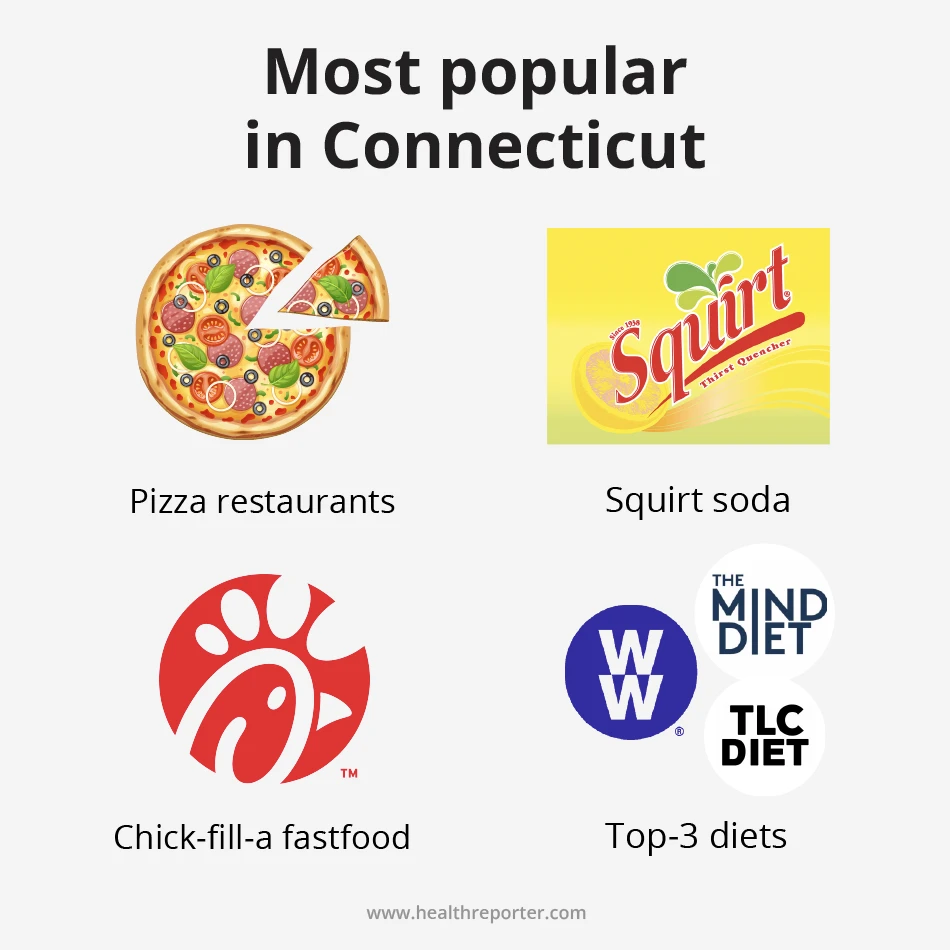
#3 Connecticut
Connecticut ranks 10th in the nation for healthy eating. Notably, the local availability of fast food is less prevalent than in other states. Residents may prefer healthier alternatives or other dining options.
- Most popular restaurant type: pizza
- Most popular fast-food restaurant: Chick-fil-A
- Most popular soda: Squirt
- Most popular diets: the TLC diet, the MIND diet, Weight Watchers
Most residents value home-cooked meals and invest in grocery purchases. Connecticut residents spend an average of $261.44 on food eaten at home, ranking 15th.
A preference for home-cooked meals and limited use of fast food suggests a healthy approach to eating and may contribute to residents’ overall happiness. However, with a ranking of 39th in fruit and vegetable consumption, Connecticut shows a relatively lower focus on these foods compared to other states.
#4 New Jersey
New Jersey’s 17th-place ranking for healthy eating still puts the state at the top of the list, indicating that nutritious food choices are common. Ranking 16th for finding healthy eating tips online indicates a higher than moderate interest in information about nutritious diets.
- Most popular restaurant type: Italian
- Most popular fast-food restaurant: Chick-fil-A
- Most popular soda: Monster Energy
- Most popular diets: Weight Watchers, vegetarian and vegan diets
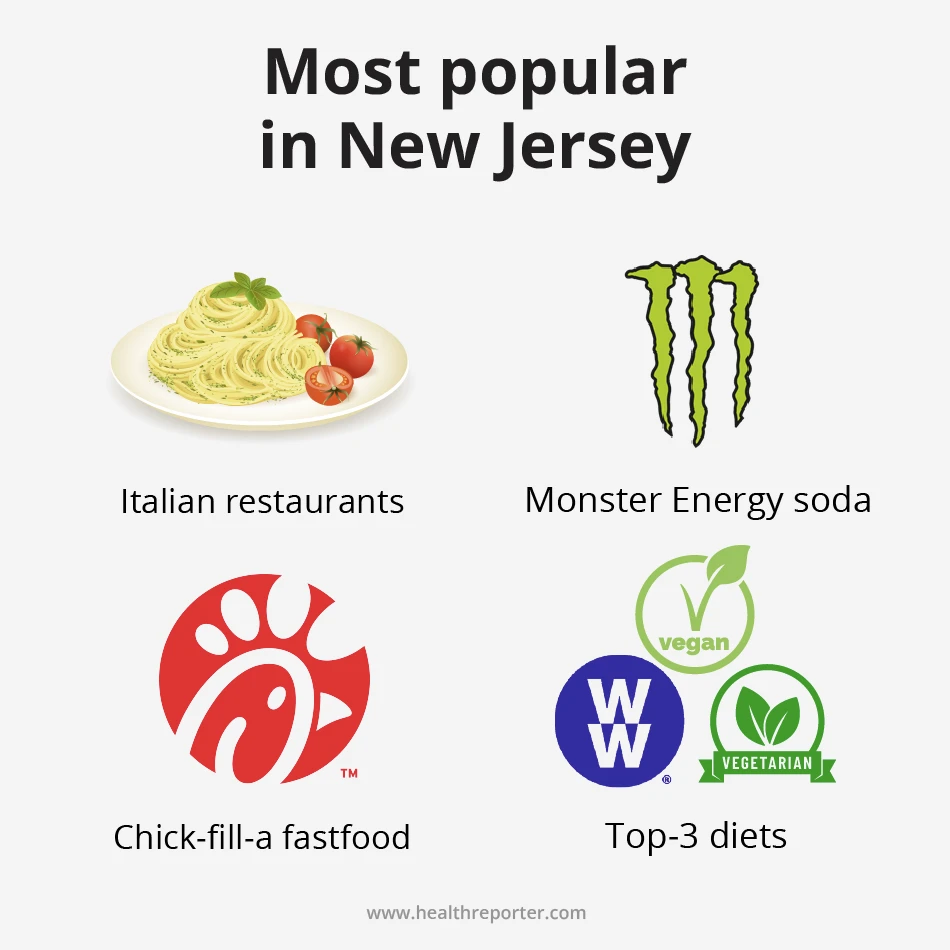
Fast food options are relatively plentiful in New Jersey, with 81.2 fast food establishments per 100,000 residents, ranking 11th highest.
The amount spent on food prepared elsewhere, including eating out and delivery ($116.42), is 5th highest. This suggests that fast food is readily available and may be influencing the dietary choices of the state’s population.
However, the amount spent on food eaten at home ($290.11) is even higher, ranking 4th. Perhaps New Jerseyans just love to eat, which is why they are one of the happiest states in the country.
Alcohol consumption in the state seems moderate (27th). New Jersey ranks 5th in fruit and vegetable consumption, suggesting a strong commitment to healthy eating.
Overall, the results show a mixed picture of diet and health-related behaviors in New Jersey. The popularity of fast food outlets and prepared foods in other states shows where healthier habits and choices can be improved.
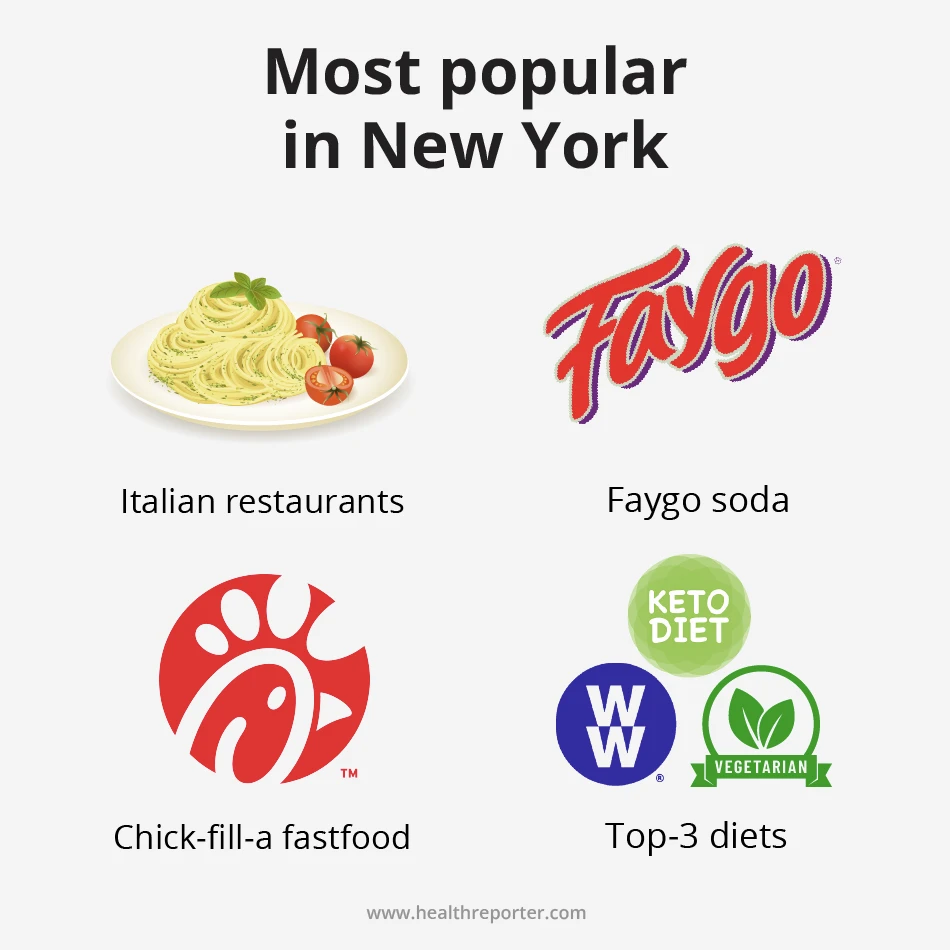
#5 New York
The 5th happiest US state ranks 21st in healthy eating, which is an average position. New Yorkers are particularly interested in searching for healthy tips online, with a high score of 68.80%, ranking 5th.
New York has a high number of fast food outlets, with 92.3 per 100,000 people, ranking 2nd. The accessibility of fast food makes a balanced and nutritious diet a challenge, but as we can see, it hasn’t stopped New York from being one of the happiest states.
- Most popular restaurant type: Italian
- Most popular fast-food restaurant: Chick-fil-A
- Most popular soda: Faygo
- Most popular diets: the keto diet, Weight Watchers, and vegetarian diets
The average amount spent on food eaten at home ($253.72) is relatively low, ranking 23rd. Why is that? There’s no escaping the fact that NYC apartments are tiny. As a result of working more than in other states, residents prefer quick options like street food and delivery.
By the way, the average spending on these is the 12th highest in the country ($106.82).
Alcohol consumption in New York appears moderate but lower than in other happiest states (33rd). New York shows a strong commitment to eating these healthy foods, ranking 3rd in fruit and vegetable consumption.
While there is a strong interest in eating fruits and vegetables, searching for healthy eating tips online, and relatively low alcohol consumption, the high number of fast food outlets and lower levels of home cooking may negatively affect New Yorkers’ diets and well-being.
#6 Maryland
Maryland has an average healthy eating score of 5.9, ranking 18th. The same rank – 18th – for searching for healthy eating tips online shows a moderate interest in making nutritious choices.
- Most popular restaurant type: pizza
- Most popular fast-food restaurant: Chick-fil-A
- Most popular soda: Jones Soda
- Most popular diets: Jenny Craig, vegan, and vegetarian diets
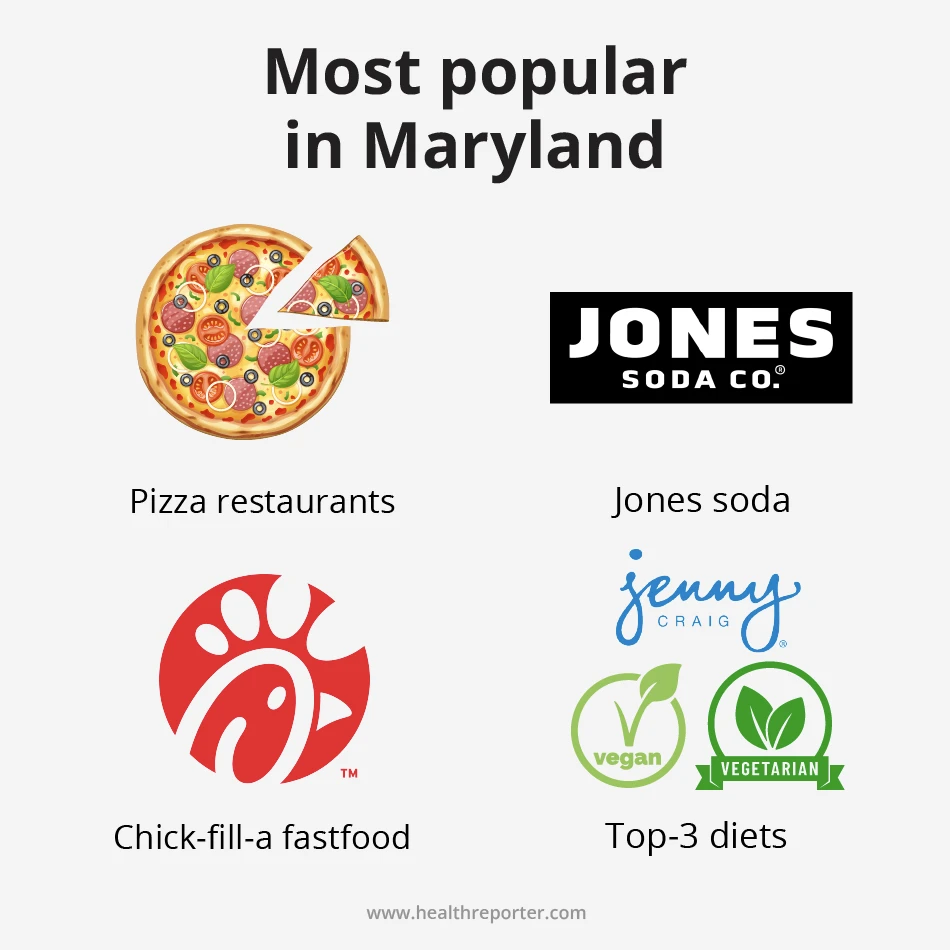
Maryland has a relatively high number of fast food outlets at 89.7 per 100,000 people, ranking 3rd (just behind New York). Residents spend the 4th highest amount on eating out and delivery – $119.38.
But people here also love to eat at home. The average amount spent on food eaten at home ($278.05) ranks 6th. This can help provide greater control over ingredient choices and promote healthier eating habits.
Alcohol consumption is relatively low in Maryland, ranking 31st. With a notable second place in fruit and vegetable consumption, Marylanders prioritize maintaining a healthy diet rich in fruits and vegetables.
Overall, the dietary patterns of the 6th happiest state are similar to those of New York. Is it Marylanders’ love of fresh vegetables that makes them happy?
#7 Minnesota
Minnesota has the 6th highest healthy eating score, indicating that the population tends to make better food choices than many other states. It also ranks 15th out of all states for online searches for healthy eating tips.
- Most popular restaurant type: pub
- Most popular fast-food restaurant: Chick-fil-A
- Most popular soda: Orange Soda
- Most popular diets: the Mayo Clinic, SlimFast, and Mediterranean diets
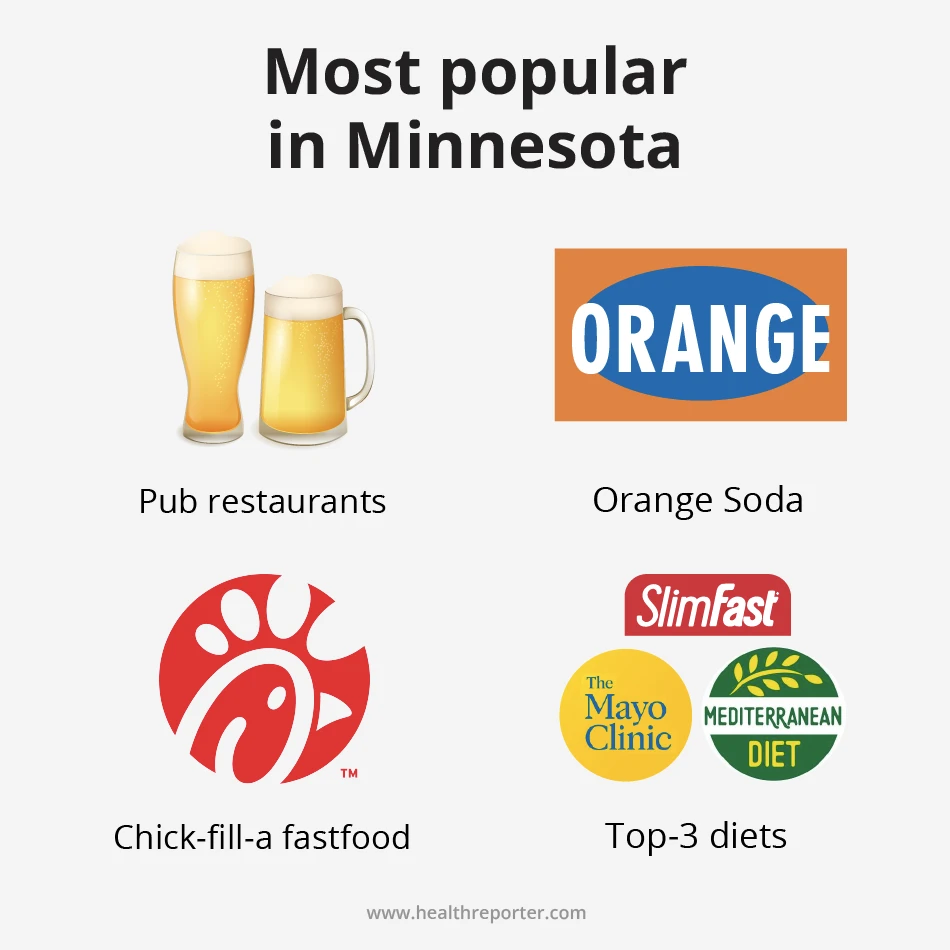
Minnesotans are particularly interested in weight management and seek guidance from reputable sources such as the Mayo Clinic. With the 12th highest alcohol consumption score, Minnesotans have moderate to high rates of alcohol consumption.
The number of fast food outlets per 100,000 people is relatively low (42nd). Minnesotans spend a median of $89.91 on eating out and delivery, which is about average for all states. However, this does not mean that Minnesotans prefer to cook at home – they ranked 40th in this category.
In terms of fruit and vegetable consumption, Minnesota ranks 17th, indicating moderate consumption of these healthy foods. The preference for pubs suggests that Minnesotans value community-oriented dining and prioritize comfort and relaxation.
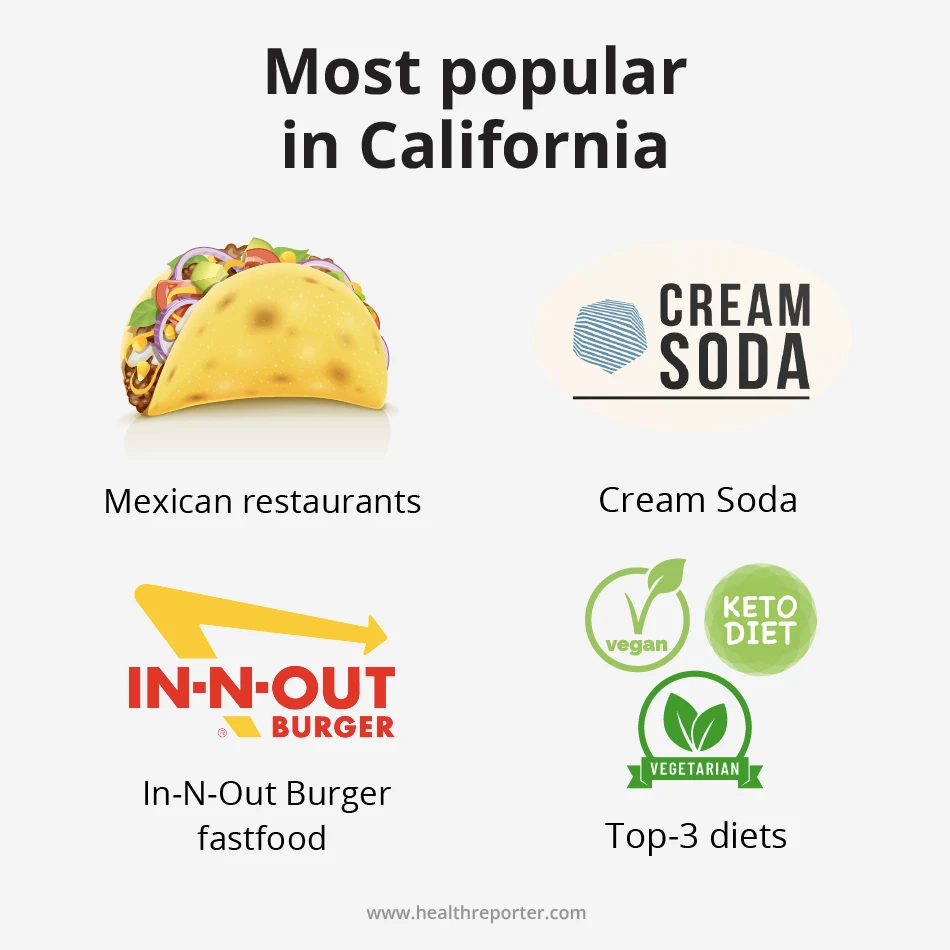
#8 California
California ranks 8th among the states for healthy eating, indicating a conscious effort to maintain a balanced diet. The state is also proactive about healthy eating, as evidenced by its 8th-place ranking in online searches for tips.
- Most popular restaurant type: Mexican
- Most popular fast-food restaurant: In-N-Out Burger
- Most popular soda: Cream Soda
- Most popular diets: vegetarian, keto, and vegan diets
Californians have a lot of fast food outlets per 100,000 people (8th). But they also embrace home cooking.
On average, residents spend $292.89 on food eaten at home, ranking 3rd in the nation. This suggests a preference for fresh ingredients and the ability to customize meals according to personal preferences.
When it comes to alcohol consumption, residents fall in the middle. It’s about average compared to other states.
California also ranks 22nd in fruit and vegetable consumption, indicating a moderate but not leading focus on incorporating these healthy foods into the diet.
Californians also like to explore culinary experiences outside of their homes. They spend an average of $133.74 on eating out and delivery, ranking 2nd.
In summary, California stands out as a state where healthy eating habits and a love of diverse culinary experiences coexist. Californians strive for a balanced diet, demonstrate a passion for home cooking, and eagerly explore the rich culinary landscape inside and outside their homes.
#9 Hawaii
While the state ranks 16th in the healthy eating score, Hawaiians show a commendable interest in nutrition by ranking 10th in the search for healthy eating tips.
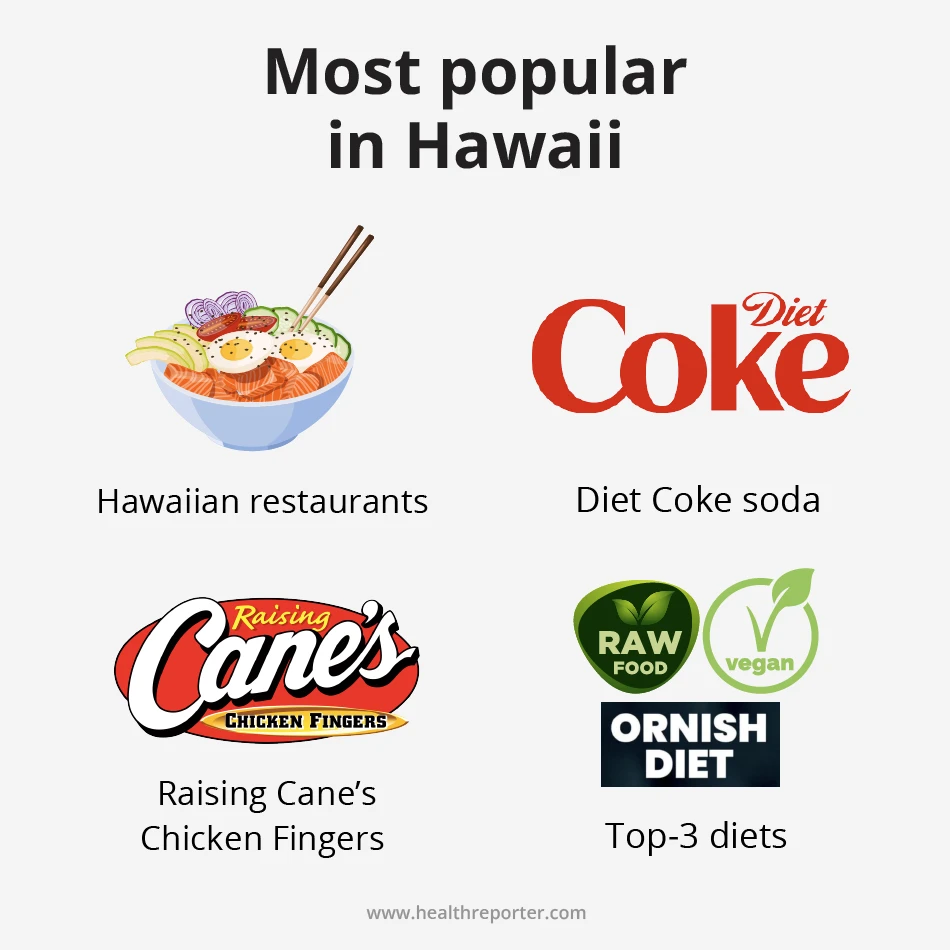
- Most popular restaurant type: Hawaiian
- Most popular fast-food restaurant: Raising Cane’s Chicken Fingers
- Most popular soda: Diet Coke
- Most popular diets: the Ornish Diet, Raw Food, and vegan diets
This preference for Hawaiian restaurants indicates a strong connection to their cultural roots and a desire to celebrate local flavors. Diet Coke shows the population’s preference for low-calorie soda options.
Hawaii ranks 9th in fruit and vegetable consumption due to its tropical climate and abundance of fresh fruits and vegetables.
Interestingly, despite its emphasis on healthy eating, the state has the highest number of fast food outlets per 100,000 people, with a score of 97.5. However, Hawaiians also prioritize home cooking. With an average expenditure of $325.37 on food eaten at home, they also rank 1st in the nation.
When it comes to food prepared elsewhere, including eating out and delivery, Hawaiians again lead the pack, spending an average of $153.21. When it comes to alcohol consumption, Hawaii ranks 15th with an above-average score.
In summary, Hawaiians present an intriguing mix of cultural appreciation, indulgence, and a commitment to healthy eating. They value home cooking, spend generously on food prepared away from home, and show a strong interest in health-conscious diets.
# 10 Vermont
Vermont ranks 2nd among the states in healthy eating, demonstrating a strong commitment to overall well-being. Interest in nutrition is demonstrated by a score of 60.60% for searching online for healthy eating tips (13th highest).
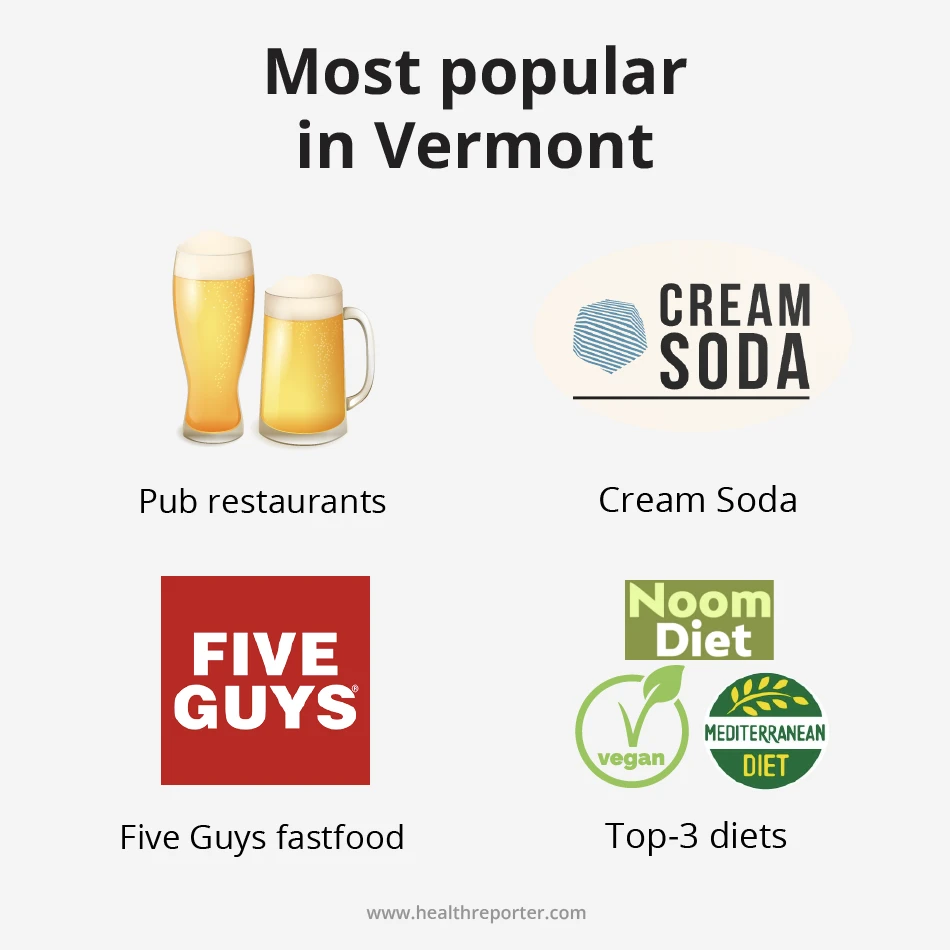
- Most popular restaurant type: pub
- Most popular fast-food restaurant: Five Guys
- Most popular soda: Cream Soda
- Most popular diets: Noom, vegan, and Mediterranean diets
Compared to other states, Vermont has a relatively low number of fast food outlets, ranking 39th with 68.3 per 100,000 people. Home cooking is also less important in Vermont. The state ranks 45th in the average amount spent on food eaten at home, at $230.89.
Despite the focus on healthy eating, Vermonters still enjoy drinking, with a score of 3.06 (6th highest). Vermonters rank 49th in eating out and delivery with an average expenditure of $74.00.
Compared to other states, Vermonters show less interest in eating at home and more interest in eating out. In addition, it is the only state among the 10 happiest that consumes a high amount of alcohol. Still, Vermont shows a strong interest in maintaining a healthy diet based on its reported good health, the number of gyms per capita, and the number of non-smokers.
Explore Main Findings by Eating Pattern Category
Healthiest eaters
- Colorado
- Vermont
- Washington
- Massachusetts
- Oregon
- Minnesota
- Utah
- California
- Arizona
- Connecticut
- Delaware
- Tennessee
- Indiana
- Kentucky
- Mississippi
- Alabama
- Arkansas
- West Virginia
- Louisiana
- Oklahoma
Online search for health tips
- Oregon
- Colorado
- Arizona
- Washington
- New York
- Utah
- Nevada
- California
- Massachusetts
- Hawaii
- Nebraska
- Louisiana
- Montana
- Delaware
- Mississippi
- Wyoming
- South Dakota
- North Dakota
- West Virginia
- Alaska
The number of fast food outlets per 100,000 people
- Hawaii
- New York
- Maryland
- Nevada
- Ohio
- Georgia
- Illinois
- California
- Alabama
- Rhode Island
- Iowa
- Minnesota
- Washington
- North Dakota
- Florida
- Idaho
- Wisconsin
- South Dakota
- Wyoming
- Alaska
Home cooking (based on the average amount spent on food)
- Hawaii
- Alaska
- California
- New Jersey
- Louisiana
- Maryland
- Texas
- Utah
- Washington
- Nevada
- Nebraska
- Wisconsin
- Iowa
- Indiana
- Michigan
- Vermont
- Kansas
- South Dakota
- New Hampshire
- Missouri
Eating out and getting food delivery
- Hawaii
- California
- Nevada
- Maryland
- New Jersey
- Alabama
- Georgia
- Florida
- Illinois
- Texas
- Maine
- Vermont
- New Hampshire
- Montana
- South Dakota
- Michigan
- Wisconsin
- Nebraska
- Idaho
- Iowa
Alcohol consumption
- New Hampshire
- Delaware
- Nevada
- North Dakota
- Montana
- Vermont
- Idaho
- Wisconsin
- Colorado
- Maine
- Utah
- West Virginia
- Arkansas
- Oklahoma
- Georgia
- Kansas
- Kentucky
- Alabama
- Ohio
- Maryland
Fruit and vegetable consumption
- District Of Columbia
- Vermont
- New York
- New Jersey
- New Hampshire
- Arkansas
- Connecticut
- Michigan
- Rhode Island
- California
- Oklahoma
- Mississippi
- Alabama
- West Virginia
- Missouri
- Idaho
- Nevada
- New Mexico
- North Carolina
- Louisiana
Methodology
To make the Happy Eating rating, we used the “Happiest States in the US” index and compared the happiness ratings of all the 50 US states with 8 other metrics:
- Healthiest eaters by states
- Healthy eating searches on Google
- Fast-food outlets per 100,000 people
- Average amount spent on food eaten at home
- Average amount spent on food prepared elsewhere, including eating out and delivery
- Total alcohol consumption in gallons of ethanol per capita by state
- Fruit and vegetable consumption
- Most popular diets based on Google search volume
We also looked at statistics on the most popular restaurant type, fast food type, and soda type.
These factors affect a wide range of issues, from health and nutrition to economics. In this way, we thoroughly understood how people living in these states might eat.
By comparing the rankings and statistical data, we revealed the key characteristics of eating habits in the top 10 happiest states in the US.
Click here for the full research table
Sources
- Andrew Van Dam. (2022, September 30). The most common restaurant cuisine in every state, and a chain-restaurant mystery. Washington Post; The Washington Post:
https://www.washingtonpost.com/business/2022/09/29/chain-restaurant-capitals/ - Barclay, T. (2022, June 5). Which States and Cities Are the Healthiest? Innerbody; Innerbody Research:
https://www.innerbody.com/healthiest-states-and-cities-in-america#methodology - Happiest States in the U.S. By Container: Scholaroo Year: 2023
- Healthy food choices are happy food choices: Evidence from a real life sample using smartphone based assessments — NIH:
https://www.ncbi.nlm.nih.gov/pmc/articles/PMC5719018/ - Most popular diets based on Google search volume (2023): In-house data
- Most Popular Soda by State 2023. (2023):
https://worldpopulationreview.com/state-rankings/most-popular-soda-by-state - Pelkey, M. (2022, October 12). CashNetUSA Blog:
https://www.cashnetusa.com/blog/most-popular-fast-food-by-state/ - Publications | National Institute on Alcohol Abuse and Alcoholism | Surveillance Report #115. (2018). Nih.gov:
https://pubs.niaaa.nih.gov/publications/surveillance115/CONS18.htm#fig7 - Team, G. (2022, February 4). U.S. States With the Healthiest Eaters, According to Their Residents – Gurney’s. Gurney’s Blog:
http://www.gurneys.com/blog/states-with-the-healthiest-eaters/ - The Fast Food Capitals of America | NiceRx. (2023). Nicerx.com:
https://www.nicerx.com/fast-food-capitals/ - The relationship between nutrition and depression in the life process: A mini-review
https://www.sciencedirect.com/science/article/pii/S0531556522003813 - U.S. Chain and Independent Restaurants. (2021). Github.io:
https://friendlycities-gatech.github.io/chainness/ - US Census Bureau. (2023, March 22). Household Pulse Survey Data Tables. Census.gov:
https://www.census.gov/programs-surveys/household-pulse-survey/data.html#phase3.7


Interview With Dr. Sheri Colberg from ADA: "Get active and do things you enjoy"

Interview With Dr. Katie Rickel: "Weight loss is not just about eating less and moving more"

Interview With David Starbuck Smith: "The body knows how to heal itself"